
Analyzing Your Process
Explore
Explore shows every attribute of the objects in your current cohort as a distribution you can pick from. It answers "what does this group actually look like?" — and the values you pick become a filter the rest of the project answers to.
What Explore answers
The map shows how work flows. Explore shows what the work is: which channels orders come through, which customers they belong to, what they are worth, what status they are in, how long each one took. It is the fastest way to get a feel for a cohort, and the fastest way to narrow it.
Open it from Explore in the project sidebar. The copilot can also link here with a cohort already applied.
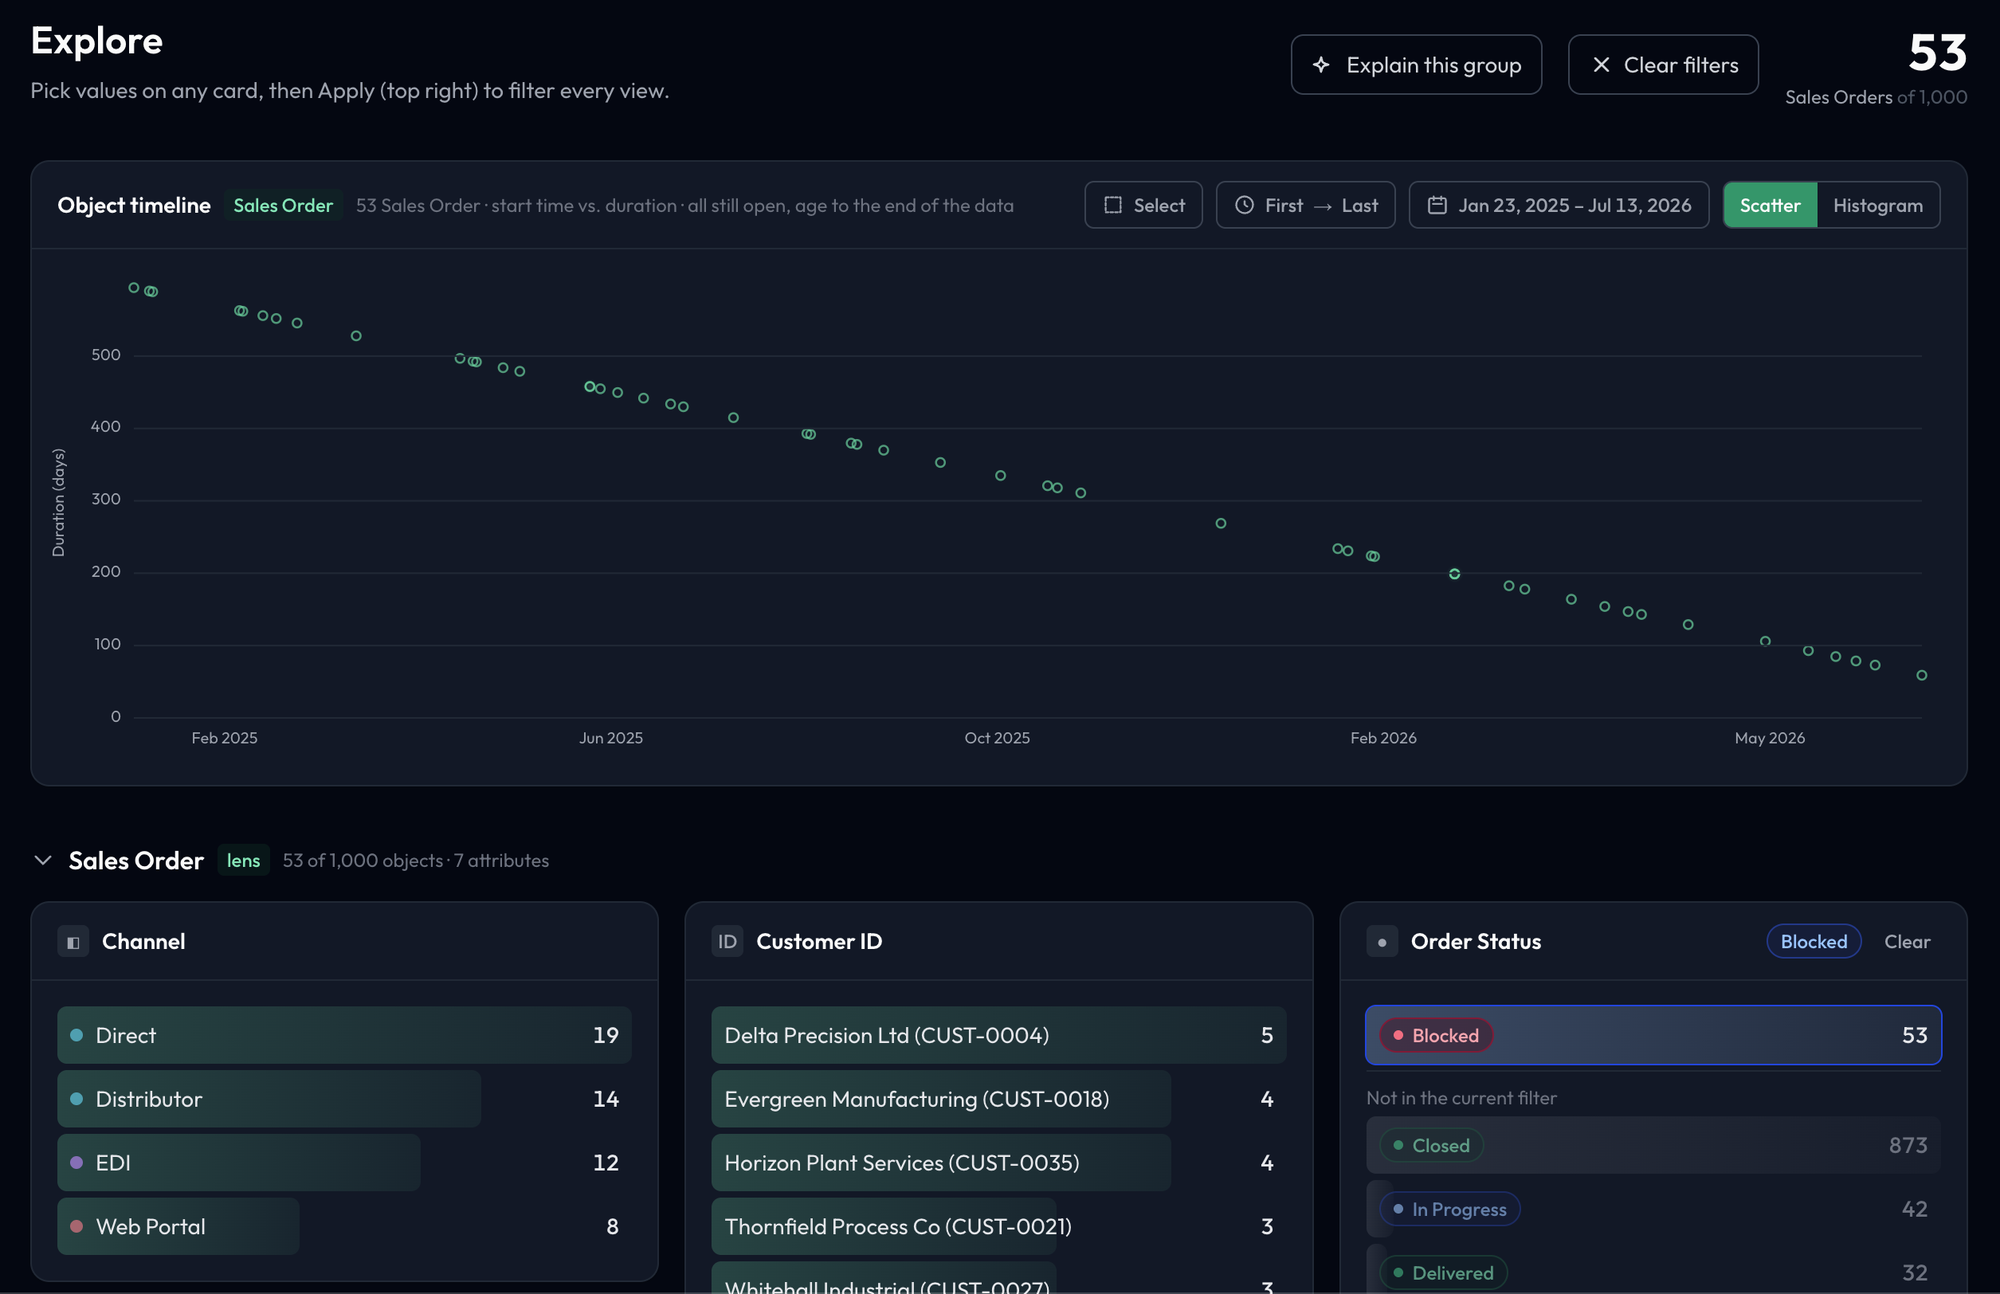
The page, top to bottom
The cohort count
In the top-right, how many objects of the lens type are in the current cohort — for example "1,000 Sales Order" with nothing filtered, and "42 Sales Order of 1,000" once a filter narrows it. When a filter is active, Clear filters appears beside the count, and Explain, next to the filter icon in the top bar, opens Compare to see what statistically distinguishes the group from the rest.
Object timeline
A card plotting every object in the cohort by when it started and how long it took. Objects that are still open are hidden until you press still open, which shows them as hollow dots at their age so far, measured to the end of the data: an order that has been stuck for a year sits at a year, not at the few days between its first and last events. Because they are all measured to the same date, they line up along one diagonal. When nothing in the group has finished, the open objects show on their own. Its header tells you how many objects it plotted and how many it left out because they have no measurable duration.
- Select — draw a box around a cluster of dots to filter to just those objects
- Measure from — the two events the duration is measured between, which default to the first and last. The pickers list exactly the events drawn in the current view, including events from related objects you have interleaved on the map
- Date range — the window shown, and how an object has to relate to it to count (started in it, ended in it, active in it, or contained in it)
- Scatter / Histogram — the same objects as dots, or as a distribution of durations
Attributes, by object type
Then one section per object type, the lens object first and expanded, related object types collapsed underneath with their object and attribute counts. Open a section to load it. A type that no chain of relations links to the lens is still listed, captioned can't filter this lens, and its values can't be picked; switch the lens to that type to filter by them.
Each attribute is a card, and the card's shape follows the data:
- Categories — a bar per value with its count, most common first. Click values to pick them; several values picked on one card mean any of them. Hover a row for Filter out, which keeps everything except that value — a value can be picked or filtered out, never both. Long lists show the top values with Show more, which opens a scrolling list you can search
- Numbers — a histogram of the range. Click bars or drag across them to pick one continuous band: clicking outside the band extends it, clicking an end bar drops it, and clicking a bar inside cuts the band there
- Dates — the range present in the data and two date pickers. Pick this date range picks it
- Countries — a map band where the data has locations
Attributes that belong to the lens object's events, rather than to the object, get their own Event attributes section, one event type at a time.
Enrichments appear here as ordinary attributes, so a derived value such as days late can be explored and filtered like anything that came in with the data.
Picking, then applying
Picks don't filter straight away. A picked value or band is outlined with a dashed line, and the top bar shows N changes to apply with the number of objects the page will show once they are applied. Pick on as many cards as you like, then press Apply (or Enter); Cancel (or Esc) drops them. Open the change count to undo a single pick.
Once applied, every card shows the filtered cohort. The card you picked on keeps what you need to change your mind: a category card lists the values it now leaves out under Not in the current filter, still pickable, and a number card keeps all its bars with your band highlighted.
Clear in a card's header removes that card's filters at once — no Apply needed — and so does the × on a filtered out chip or on a number card's band.
Filters and the lens
Explore always shows the current cohort: every active filter, including a pinned one, applies, and every Apply adds to them. Picks on the same card combine as any of; picks on different cards all have to hold. Filters made here are ordinary filters — they appear in the Active Filters panel, travel in the URL, and every other page in the project answers to them.
The page is organised around the lens. Its object type comes first, its events supply the event-attribute sections, and the counts are in its units. Switch the lens on the map and Explore reorganises around the new object — picks you hadn't applied are dropped.
Walkthrough: order channels in Order to Cash
In the Examples workspace, open Order to Cash and go to Explore.
- With no filter active the count shows every sales order, and the Sales Order section is open at the top.
- The Channel card lists Direct, EDI, Distributor and Web Portal with their counts; Order Status shows most orders Closed, with much smaller groups In Progress, Blocked and Delivered.
- Click Blocked, then In Progress, in Order Status. Both are outlined, the card's header reads Blocked or In Progress, and the top bar shows 1 change to apply with the count you will get.
- Press Apply. The count in the top-right drops to those orders, shown against the total (N Sales Order of M), and every other card — the timeline included — redraws for just them. Order Status lists Closed and Delivered under Not in the current filter if you want to add them.
- Click Explain, next to the filter icon in the top bar, to open Compare with the orders as Group A, or Clear filters to go back to every order.
Working with the rest of the product
- Into filters — every Apply makes filters the whole project answers to
- Into Compare — Explain, next to the filter icon in the top bar, opens Compare with the cohort as Group A
- From the copilot — a link card labelled for Explore analytics opens the page with the conversation's cohort and lens
- From Data Scope — which object types and event types have sections here is decided by the project's data scope
Next steps
- Filters & Exploration — everything a filter can express
- Compare — put the cohort you have built beside another
- Enrichments — derive the attribute you wish your data had
Look before you ask
Five minutes picking through Explore usually tells you which question to ask the copilot. The distributions are the raw material; the interesting ones are rarely the ones you expected.