
Introduction
Getting Started with Flow Myna
Flow Myna reads the event data your systems already produce and shows how work actually flows: the routes, the waits, the rework, and where things are sitting right now. Bring your data, approve how it was read, and start asking questions.
What is Process Mining?
How process mining works, and why a map drawn from data beats one drawn from memory.
Upload Your Data
CSV, XES or OCEL 2.0. The wizard proposes the model; you approve it.
Explore Your Process
The map, the lens, parallel tracks, and the numbers behind every node and edge.
Co-Pilot
Ask about the process in plain language and get an answer computed from your data.
Loan applications, order fulfilment, support tickets, manufacturing work orders — the workflow is the same. Flow Myna works out the structure of your data, then shows you how the process runs rather than how it was designed to run.
From data to a first answer
1. Create a workspace
Sign in, open Workspaces, and click New Workspace. Name it for the business area rather than the analysis. About a minute.
2. Upload your data
Open Data Management and click Create New Dataset. You can bring a CSV — one file or several linked ones — or an XES or OCEL 2.0 event log.
# Example: order events from the order-to-cash sample
event_id,order_id,activity,timestamp,user_id,block_reason,release_type
43,SO-000031,Create Sales Order,2025-02-13 08:00:00.603938,sales_user_06,,
44,SO-000031,Block Sales Order,2025-02-13 09:56:00.603938,credit_ctrl_02,Manual hold,
45,SO-000031,Unblock Sales Order,2025-02-14 09:28:00.603938,credit_ctrl_02,,manual
The wizard has five steps:
- Select Process — roughly what kind of process this is
- Upload Data — your files, or one of the samples
- Auto Mapping — agents read the files and propose an object and event model
- Check Mapping — you review and approve, correcting anything read wrong
- Transform Data — the approved mapping is executed and the data imported
No data preparation needed
Your files do not need to be tidy. Inconsistent formats, missing values and column names that mean nothing outside your team are all normal — Check Mapping is where you correct anything the agents read wrong, and nothing is imported before you approve it.
3. Create a project
A project is a scoped view: which object types and event types are in play, and which events mark the process finished. Two steps and a couple of minutes.
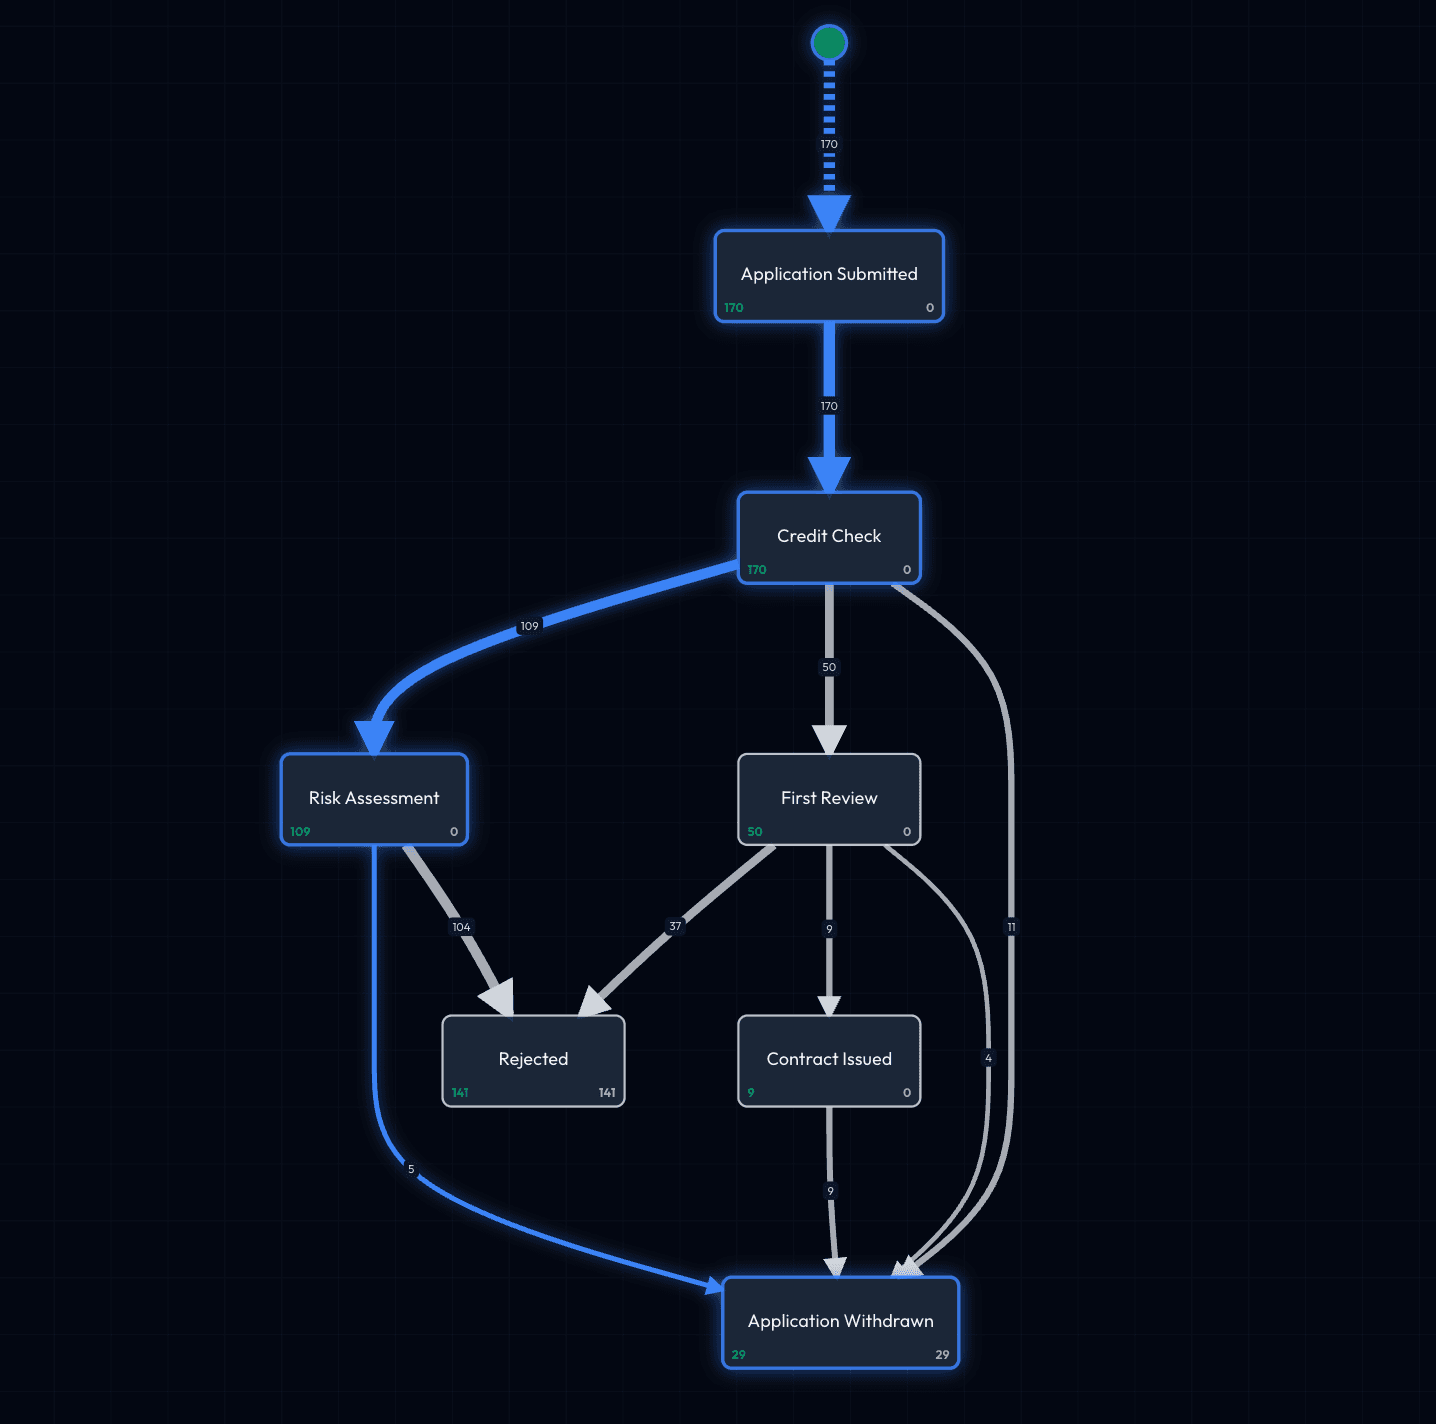
4. Read the process map
The map is drawn from your events. Follow the thick edges for the main route, the red ones for the long waits, and the backwards ones for rework. Click a node or an edge for the numbers behind it.
5. Ask the copilot
- "Show me orders that took longer than 14 days"
- "Which block reasons are most common?"
- "Are invoices for blocked orders paid late more often?"
It applies the filter, gives you the numbers, draws a chart where a chart helps, and the map beside it moves to the same cohort.
Core concepts
Objects and events
Objects are the things in your process — sales orders, order lines, deliveries, invoices, customers. Events are what happens to them, each with a timestamp. The link between the two is many-to-many: one event can touch several objects, and one object accumulates many events.
The lens
Because events belong to several objects at once, the same data can be read through any of them. The lens is the object type the map is centred on. Look at an order-to-cash process through Orders and you see fulfilment; switch to Invoices and you see the billing journey. Same events, different question.
Variants
The distinct paths objects take. A process with one designed route usually turns out to have dozens, and how concentrated they are tells you how disciplined it really is.
Where the analysis comes from
Nothing runs in the background. Copilot answers are computed when you ask the question, and every number on screen comes from your current data and current filters.
What makes Flow Myna different
The mapping is done for you, and you approve it
Most process mining tools need you to map your data to their model by hand, or pay someone to. Here agents propose the model and you check it — which is the part that actually needs your judgement.
It is object-centric
Most tools need one case ID and one linear flow. Real processes have orders, items, deliveries and invoices interacting many-to-many. Flow Myna models that, which is why you can change the lens instead of rebuilding the analysis.
Concurrency is modelled, not flattened
Work that runs in parallel is declared as parallel tracks, so the map draws lanes and names the critical path rather than producing a hundred meaningless variants.
You ask in words
No SQL, no query builder. Ask, read the answer, follow up. Where a definition matters, the copilot proposes one and asks you to confirm it, so the whole project agrees on what a number means.
Everything is a link
Filters live in the URL, so a finding is something you send rather than something you describe.
Next steps
Learn the basics
- What is Process Mining? — the fundamentals
- Object-Centric Approach — why the lens matters
- Quick Start Guide — the whole path once, step by step
Follow the workflow
- Creating Your Workspace — where data and people live
- Uploading Your Data — the wizard in detail
- Creating a Project — scope and process end points
Master the tools
- Process Map — the map and its controls
- Process Variants — the paths through it
- Co-Pilot — asking, and what comes back
Go further
- Filters & Exploration — build the cohorts worth comparing
- Saved Filters — keep the ones that matter
- Collaboration — bring your team in
Getting help
Check the FAQ first — it is written to be honest about what the product does not do yet, as well as what it does.
Otherwise, use the Feedback control in the app or email support@flowmyna.com.
Who this documentation is for
These pages are written for the people who own the process, not for data scientists. No technical background is assumed beyond being able to export a file from a system you already use.
Every page aims to describe the product as it is today. Where something is not built yet, it says so.