
Analyzing Your Process
Compare
Compare puts two cohorts side by side and tells you what separates them — in numbers, in behaviour through the process, and in a short plain-English summary written from those numbers. It answers the question every filter eventually raises: "these are different, but how?"
What Compare answers
A filter tells you what a group looks like. Compare tells you what makes it different from something else: which attributes are more or less common in it, whether it ends in different places, takes different routes, waits in different spots, and by how much.
Open it from Compare in the project sidebar. You can also arrive with a cohort already chosen: a copilot answer can link here with its filter carried, and Explain this group on Explore, or the N of M · Explain chip in the header on any page, does the same whenever a filter is active.
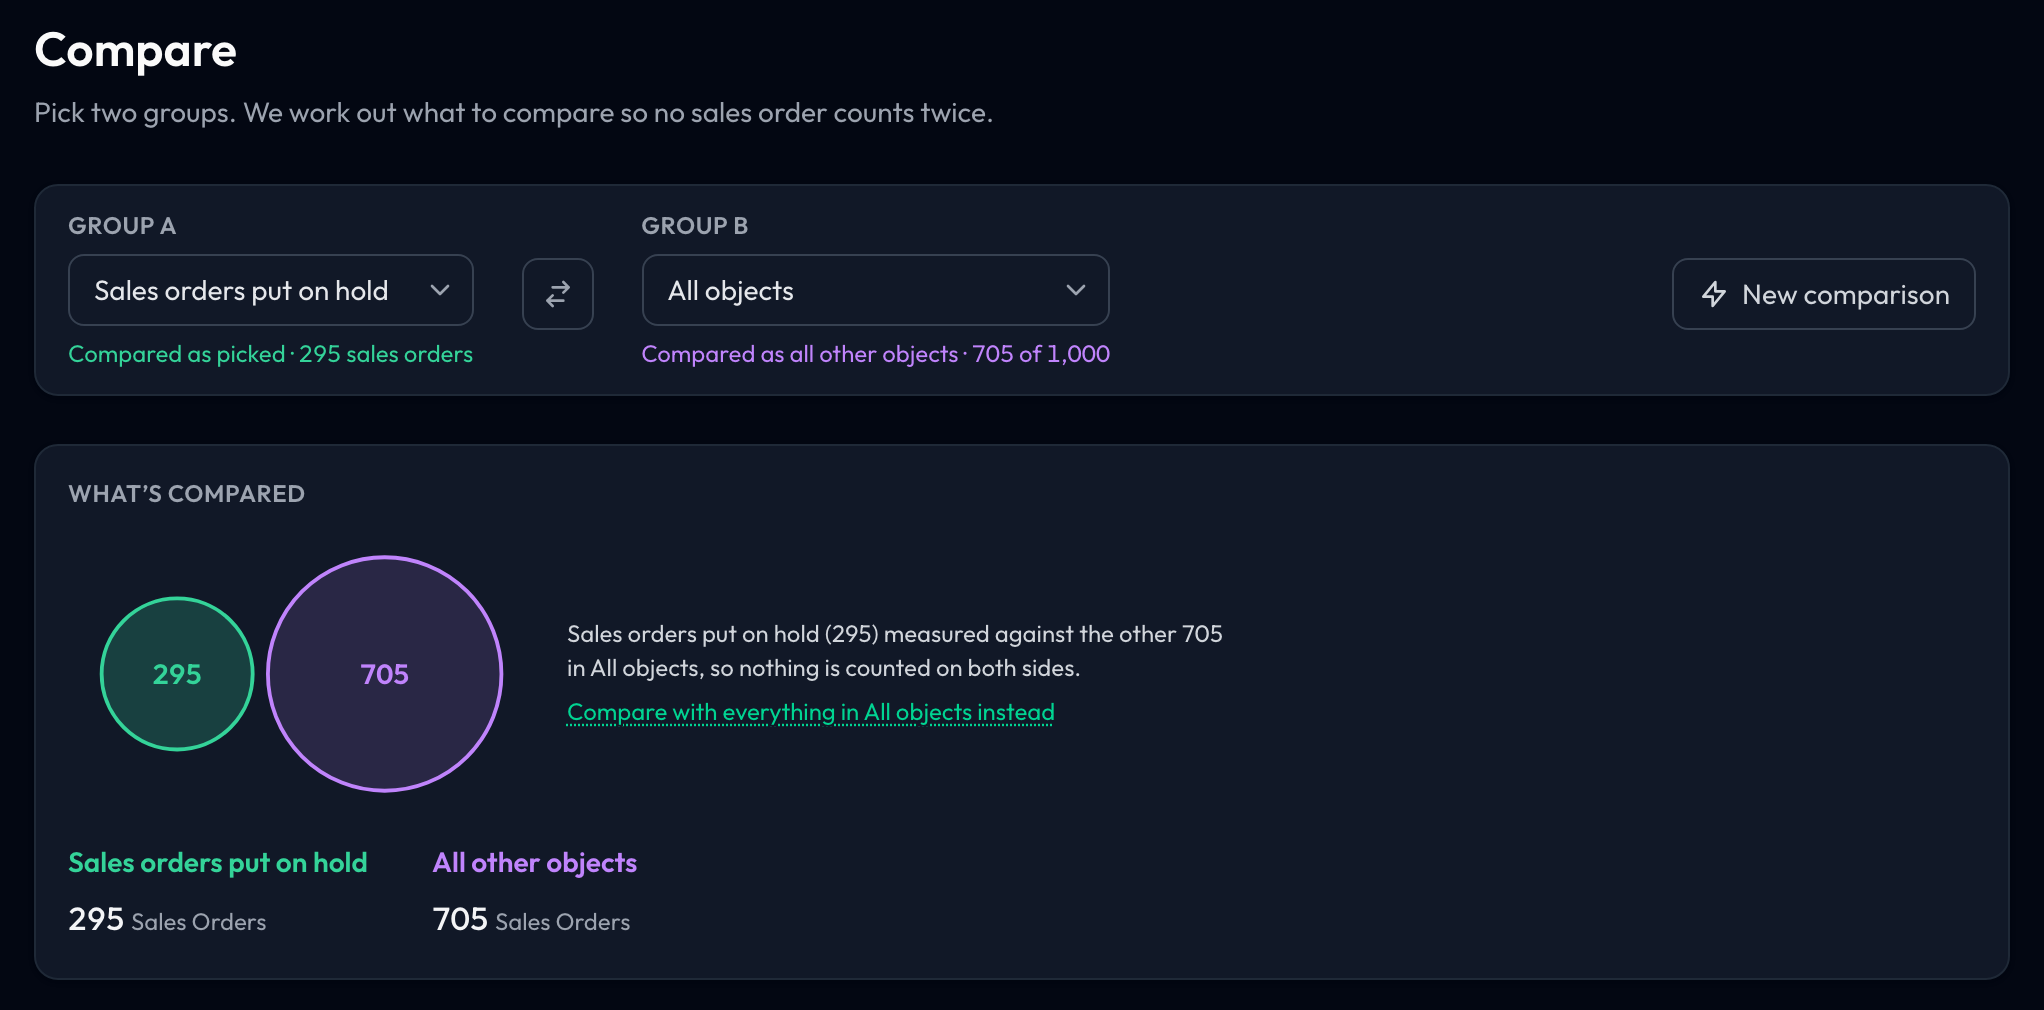
Choosing the two cohorts
The card at the top has two pickers, Group A and Group B, each with a short definition beside every option. The pickers choose the two groups you start from; what is actually compared is worked out from them, so no object counts twice. Each can be:
- Current filters — whatever is active in the project right now, including a cohort you selected (for example with the lasso) and a process crop; it is offered only while something is active. Under the picker, each active filter is listed on its own line, so you can see exactly what this side means
- All objects — every object of the lens type
- A saved filter — every saved filter in the project is listed under Saved filters
Under each picker, in that group's colour, is what the pick becomes in the comparison: "Compared as picked · 220 sales orders" when it is measured unchanged, or "Compared as all other objects · 780 of 1,000" (for a named group, "Compared as the others in this group · 949 of 1,000") when part of it is set aside. The What's compared card below shows the same two groups and lets you change how they are measured; the captions follow. The swap button between the pickers exchanges the two sides.
You can also describe a comparison instead of picking: New comparison, at the right of the pickers, opens a line that takes plain language — "blocked more than once vs never blocked", "high-value orders against the rest", "this quarter vs last quarter". Compare (or Enter) fills both pickers with the two groups it names and closes the line, leaving a one-line reading of what was understood; Cancel or Esc closes it without changing anything. A group named alone is compared with everything else. A described side stays in the picker for the session under Described: and can be kept with Save as filter….
Your choices are remembered for the project while your browser session lasts, so leaving Compare and coming back keeps both sides — unless you changed the active filters in the meantime (applied a filter, selected a cohort), in which case side A switches to Current filters. The defaults are your current filters against All objects when filters are active, otherwise your first saved filter; with neither, side A is left unchosen and the card says so — nothing is compared until you pick. The quickest way in is to apply a filter anywhere in the project and open Compare. If both sides resolve to the same objects — no filter active, say — the page says so in a banner rather than showing you a page of zeroes.
When Group A is Current filters, project admins also get Save current filters… under it, which saves the active stack as a named filter without leaving the page.
How the two cohorts overlap
To the right of the pickers, a small diagram shows the two groups actually being compared — drawn apart when they share no objects, nested or overlapping only when the cohorts are compared as they relate — with a sentence saying exactly which objects are being measured against which:
- A inside B — the common case, such as a filtered group against All objects. Comparing a group with a superset that contains it only dilutes the difference, so the page compares A against the rest of B, and the labels say so ("All other objects", "Others in …"). If you do want the whole of B, Compare with all of … instead switches to that, and Set A aside from B switches back.
- The two overlap — you choose. Count them on both sides compares the two sets exactly as defined; Set the shared ones aside compares only the objects unique to each.
- B inside A — there is nothing outside A to contrast against, so the page offers to swap the sides.
That sentence is worth reading every time. It is the difference between "blocked orders against everything" and "blocked orders against the orders that were never blocked".
Reading the page
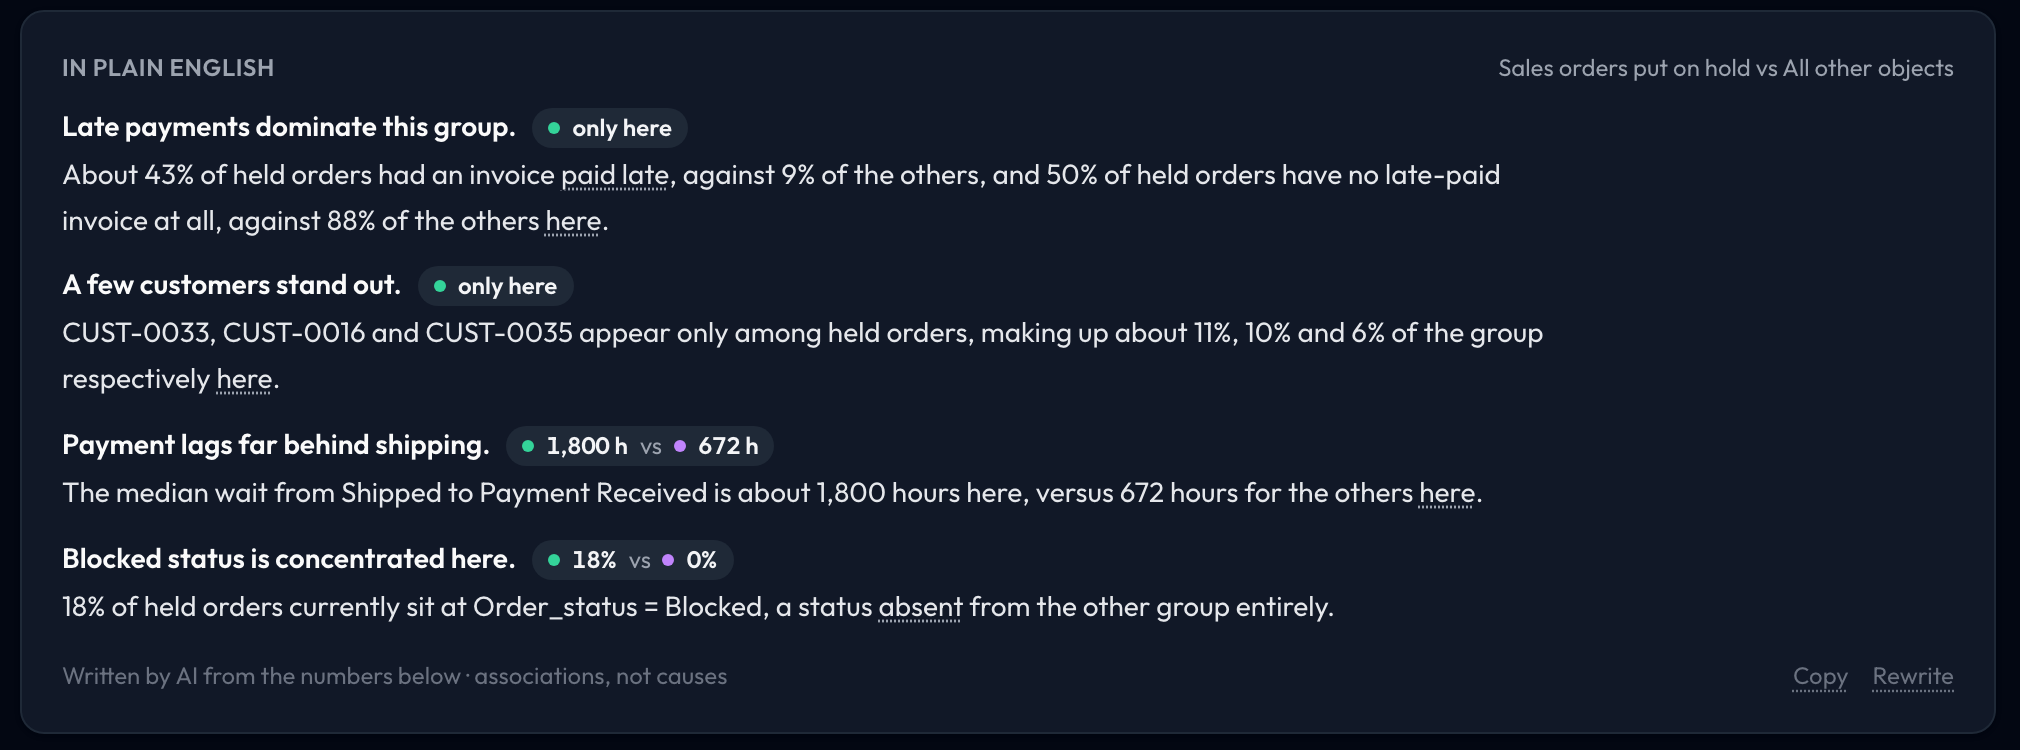
In plain English
Directly under the What's compared card, Compare writes a few observations about what sets Group A apart — only the differences worth your attention, strongest first. A metric that moved clearly between the groups can be one of them (at most one line, with its unit in the figures); a metric that follows from a group's definition never is. Each opens with a short lead ("One user shows up heavily."), shows the figures it rests on beside it (for example "57% vs 35%"), and then says in a sentence or two exactly where the difference is: which values, which step, which people. It leaves out what you already know: how the group was defined, anything that follows from that definition, and differences that only say the other group hasn't finished yet.
The detail sits below in sections (saved metrics, behavioural differences, attributes) that start folded to one line each. Each line already names the biggest difference in that section; click it to open the cards. Clicking a linked phrase in the summary opens the right section and scrolls to the card.
There are no duration tiles at the top of the page. A cycle time that ages unfinished objects to the latest data mostly says which group is newer, so Compare leaves durations to the waits between steps and to any duration metric the project has defined.
Your metrics, compared
If the project has metric definitions, the first folded section, Saved metrics, measures each one on both cohorts — a late payment rate, a median days to invoice, whatever the project has named. Its one line names the metrics that moved most; open it for a tile per metric with the value for each side, how many objects each value rests on, and the percentage difference. When the metric says which way is good, the difference is coloured accordingly: green when Group A is better, red when it is worse. Up to six metrics are shown, promoted ones first.
A metric that follows from how a group was defined — the blocked-order rate of the blocked orders — is still shown, but muted, with the note "follows from how this group was defined". It is a fact about the definition, not a finding, and the summary never mentions it. A metric that cannot be measured on one side shows "—" there. Projects without metric definitions do not get the section.
- Every number in the summary is checked against the page's own figures before it appears. If a number cannot be matched, that observation is dropped rather than shown.
- Underlined phrases are links: click one to jump to the card it came from.
- Copy takes the summary as text; Rewrite asks for it to be written again.
- It says, underneath, that it was written from the numbers below and that it describes associations, not causes. Treat it as a reading of the page, not a verdict on it.
What makes this group different
A ranked list of the conditions that best distinguish Group A from the objects it is being compared with. Each row reads like "Had 'Hold Released' at least once" and shows how much more common the condition is in A. Rows marked only here never appear on the other side.
Conditions come from the objects themselves, from the records linked to them and from events on those records. For an invoice, that includes its sales order, the order's customer, the order's items and their products: "Has a Sales Order Item (via Sales Order) with plant = Plant-B".
- Click a row to filter to the objects matching that condition; click again to remove it
- Details on a row shows the evidence, and notes when a finding largely overlaps another or only stands out in combination
- Show more, Less common here and Part of this group's definition open the rest of the list — the last keeps the conditions that are true by construction out of your way
- The footer says how many conditions were tested, and repeats that these are associations, not causes
Behavioural differences
How the two cohorts move through the process, as paired bars with the gap in percentage points (pts):
- Final activity — where objects end up
- Activity mix — the share of events each activity accounts for
- Transition mix — which step-to-step moves are more common
- Variant mix — which whole paths are more common
- Waits — the transitions where one cohort waits notably longer, or a note that there are no meaningful wait differences
Attributes
Then the attributes behind those findings, in the same order. Categorical attributes show paired bars per value with the pts gap. For linked records and events, the bars count objects with at least one such value. Numeric attributes show the two distributions overlaid, with a Lin / Log scale switch, each side's mean and the difference between them. Attributes from linked records are labelled with the path that reaches them, such as Sales Order · Sales Order Item · Plant, and enrichments appear like any other attribute. The attributes that were tested without a meaningful difference are listed underneath.
Filters and the lens
Compare counts and measures in the lens object type — the header of every tile says "Sales Order", "Invoice", or whichever object the project is centred on. Change the lens and both cohorts are re-resolved for the new object.
Group A's default, Current filters, follows the Active Filters panel, including any pinned filter. The other options are fixed: a saved filter means exactly what it meant when it was saved, and All objects means all of them.
Walkthrough: blocked orders in Order to Cash
In the Examples workspace, open Order to Cash and go to Compare.
- Set Group A to the saved filter blocked at some point and leave Group B as All objects.
- The picker shows the saved filter's name and how many sales orders it holds — about a quarter of them. The diagram shows two circles apart — the blocked orders and the other orders — and the sentence says the blocked orders are measured against the other orders in All objects — the rest, not the whole.
- The plain-English summary picks out the few differences that matter most — which blocks, customers or steps show up far more often among the blocked orders — each with its figures beside it.
- The Saved metrics line says the Late Payment Rate is several times higher among blocked orders. Open it: each metric sits on both sides, and the Blocked Order Rate is muted because it follows from the definition.
- What makes this group different leads with Had 'Hold Released' at least once, marked only here. Click it and you have filtered the project to the blocked orders that were later released — ready to compare again, against the ones that never were.
Working with the rest of the product
- From a filter — apply one anywhere, open Compare, and it is already Group A
- From the header — while a filter is on, the N of M · Explain chip beside the filter button opens Compare with that group as Group A, from any page
- From any page — when a filter is active, Explain, next to the filter icon in the top bar, opens Compare with that cohort as Group A
- From the copilot — a comparison answer can end in a link card ("Compare · 1 filter carried · Sales Order view") that opens this page with the cohort set
- From variants — use the With toggle on the Variants page to filter to a set of paths, then compare those objects with the rest
- Back into filters — every row in What makes this group different is one click from becoming a filter
Next steps
- Filters & Exploration — build the cohorts worth comparing
- Saved Filters — keep a cohort so it appears in the pickers
- Explore — the distributions of a single cohort
- Co-Pilot — ask why the difference exists
Associations, not causes
Compare is very good at telling you what is different about a group, and says every time that it cannot tell you why. The why usually comes from someone who knows the process, looking at the top two or three rows on this page.